Forecast Chart
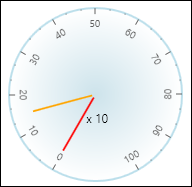
The Forecast chart displays the forecast for the item for the current month and the actual output for the month.
The red needle displays the forecast for the item for the current month, and the orange needle displays the actual output for the month.
The Forecast chart is only available from the Output screen.