Plant Interface
The Plant interface consists of several pages.
Calendar
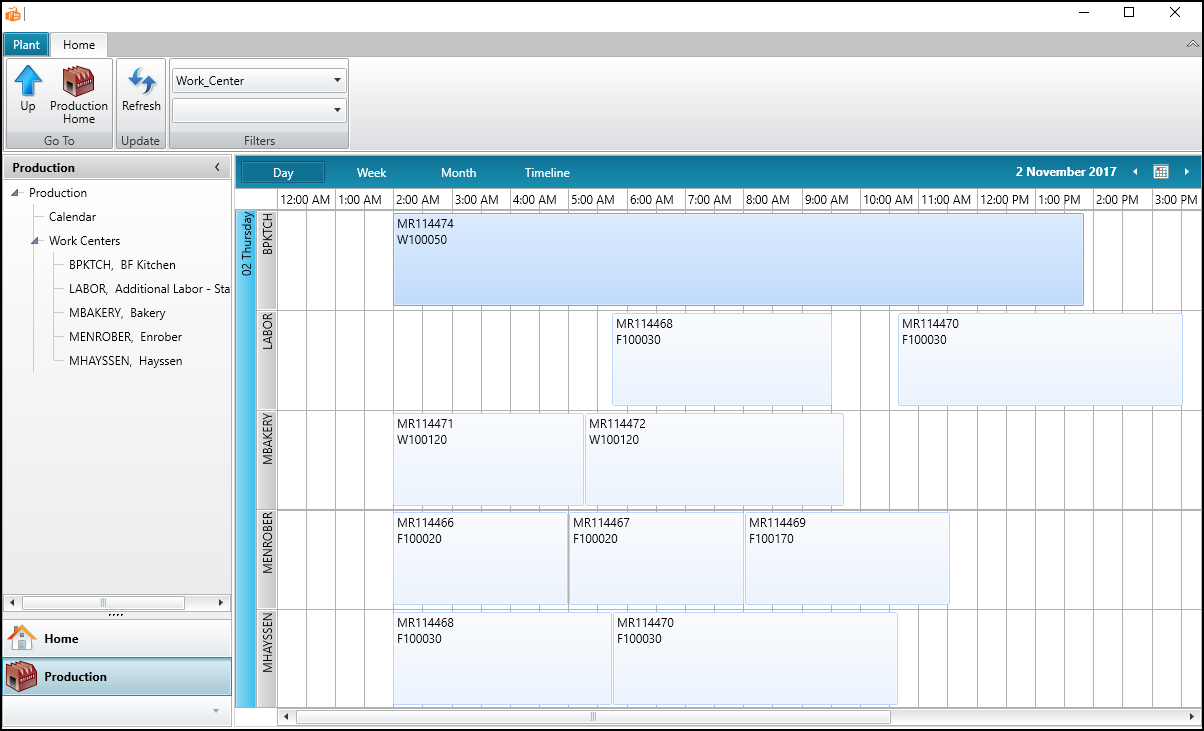
The following screen capture displays the production calendar in Plant. The calendar is displaying a day's schedule for various work centers. For example, you can see that the BPKTCH work station will be producing item W100050 (production order MR114474) from 2:00AM to 1:50PM.

Material Consumption
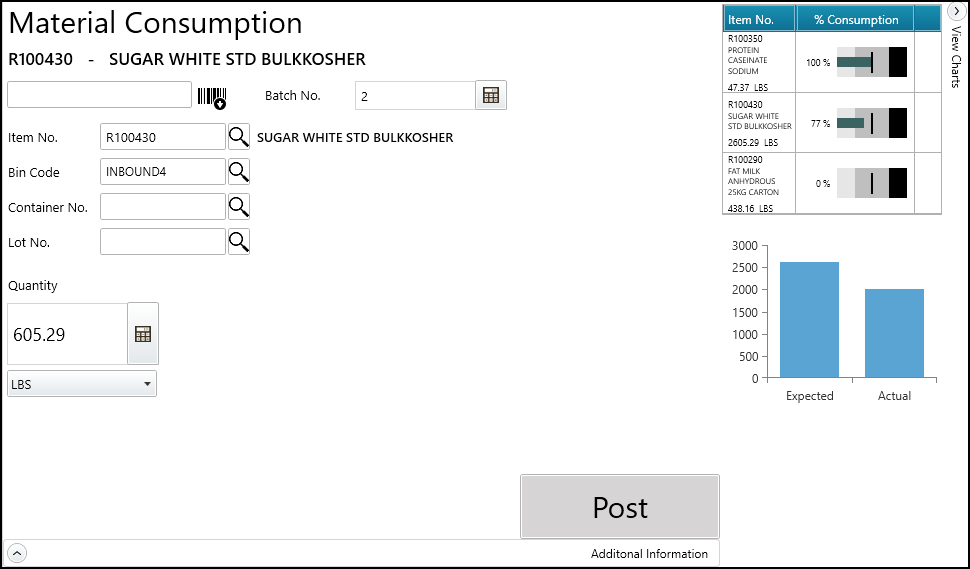
The following screen capture displays the Material Consumption page in Plant.
The R100430-SUGAR WHITE item was selected to be consumed.
The Components graph displays the items that have been consumed, or are still to be consumed. For example, 100% percent of the R100350-PROTEIN CASEINATE item has been consumed, while 77% of the R100430-SUGAR WHITE item has been consumed.
The Expected vs. Actual graph displays that 2500 LBS of the R100430-SUGAR WHITE item are expected to be consumed, and that 2000 LBS have already been consumed.

Material Output
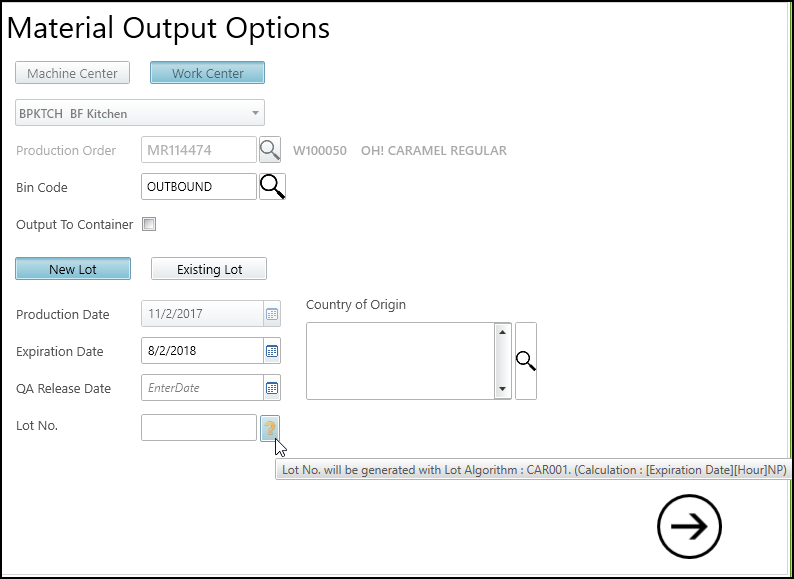
The following screen capture displays that production order MR114474 has been selected to produce the W100050-OH! CARAMEL REGULAR item. The lot number will be automatically generated based on the lot number series that is defined in JustFood.

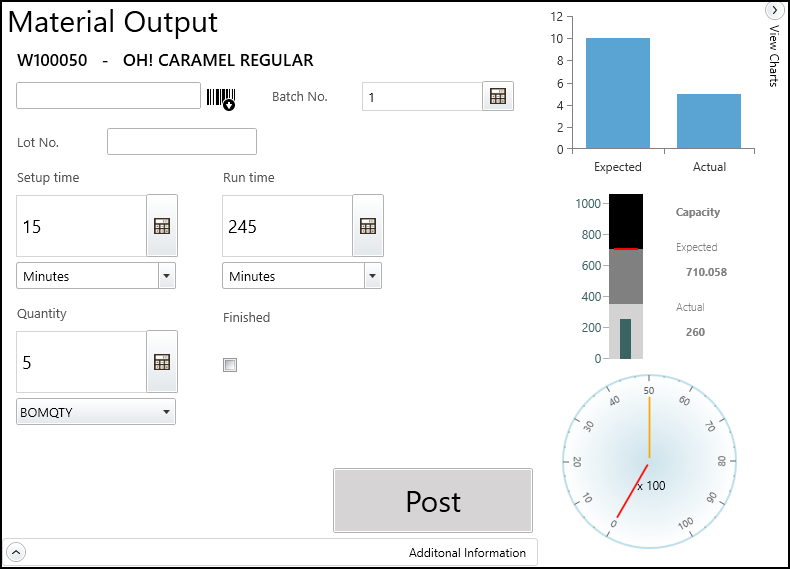
The following screen capture displays where the Plant user can enter the time it took to set up the work center, the time it took to output the items, and how many items were produced.
After the user posts the output, the data in JustFood is updated.
The graphs are updated to display the expected versus actual output, the expected versus actual time spent setting up and running, and the forecasted output versus the actual output. The red needle indicates the forecast for the item for the current month, and the orange needle indicates the actual output for the month.
In this example, a quantity of 5 was posted.
